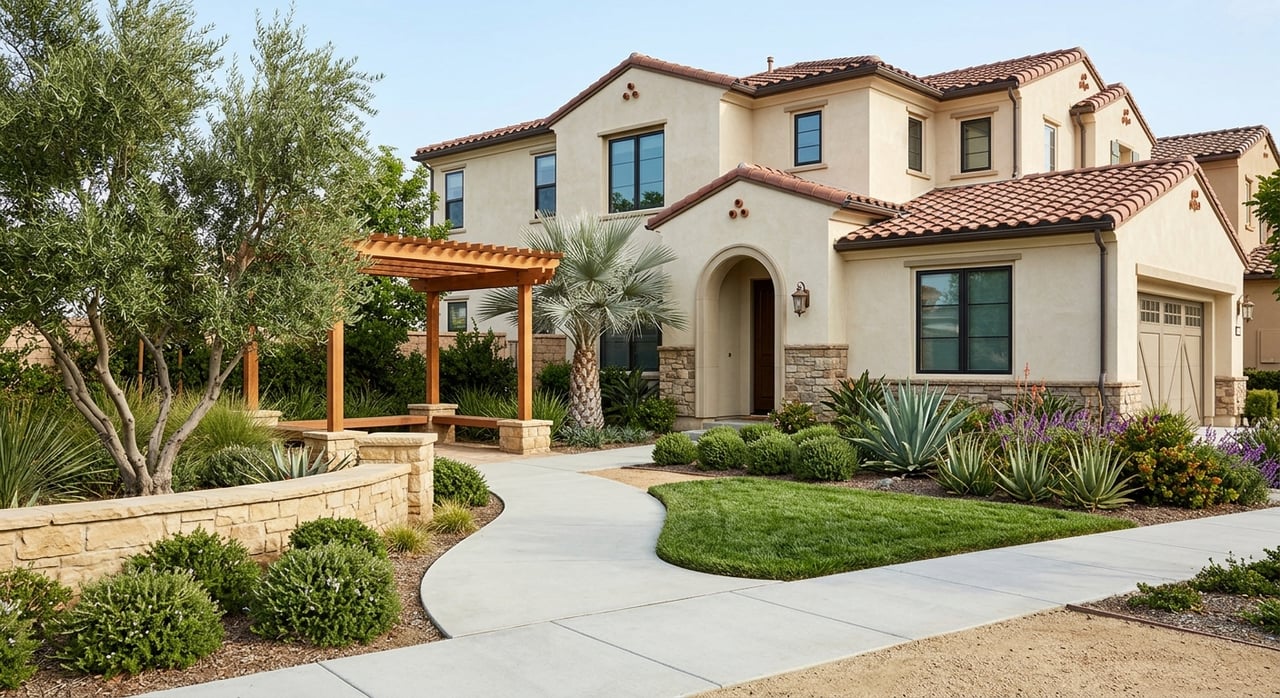
If you are comparing Brea to nearby cities before you buy or sell, you are not alone. North Orange County offers a mix of prices, property types, and commute options that can shift your plan and budget. In this guide, you will see how Brea stacks up against Yorba Linda, Anaheim Hills, and Orange using recent market snapshots, plus what those numbers mean for your next move. Let’s dive in.
How this comparison works
For price and selling tempo, we reference recent aggregator snapshots from January 2026. These include median sale price, price per square foot, and days on market as reported by widely used market dashboards. For active-listing counts, we reference late 2025 to early 2026 platform snapshots. Figures can change month to month, so treat them as a current guide and verify final numbers before you act.
There are three common value lenses you will see in real estate data. Transaction medians show what actually sold during a period. Zillow’s typical value index is an estimate of the “typical” home value. The Census American Community Survey shows owner-occupied values based on surveyed households. This guide uses transaction medians for apples-to-apples market comparisons and notes the date alongside each figure.
Quick value snapshot
Below is a simple view of how Brea compares right now. All price and $ per square foot figures reflect early 2026 transaction snapshots. Active listings reflect late 2025 to early 2026 snapshots.
| City | Median Sale Price | Price per Sq Ft | Median Days on Market | Approx. Active Listings |
|---|---|---|---|---|
| Brea | $1.15M | $579 | 27 to 33 | ~62 |
| Yorba Linda | $1.20M | $613 | ~69 | ~147 |
| Anaheim Hills | $1.08M to $1.10M | $598 | ~50 | ~77 |
| Orange | $1.20M | $636 | ~47 | ~180 |
Note on context: Zillow’s typical home value for Brea is about $1.10M in January 2026, while the ACS median owner-occupied value is lower because it is a survey of existing owners, not current sales.
Brea vs Yorba Linda
Yorba Linda typically sits a notch higher than Brea on both median price and price per square foot. In the latest snapshots, Yorba Linda lands around $1.20M and about $613 per square foot, while Brea sits near $1.15M and roughly $579 per square foot. That means a given budget may stretch farther on square footage in Brea.
Inventory and market pace differ too. Yorba Linda showed a higher median days on market in early 2026, around 69 days, while Brea’s median ran closer to 27 to 33 days. Listing counts also skew larger in Yorba Linda, which speaks to its broad single-family stock.
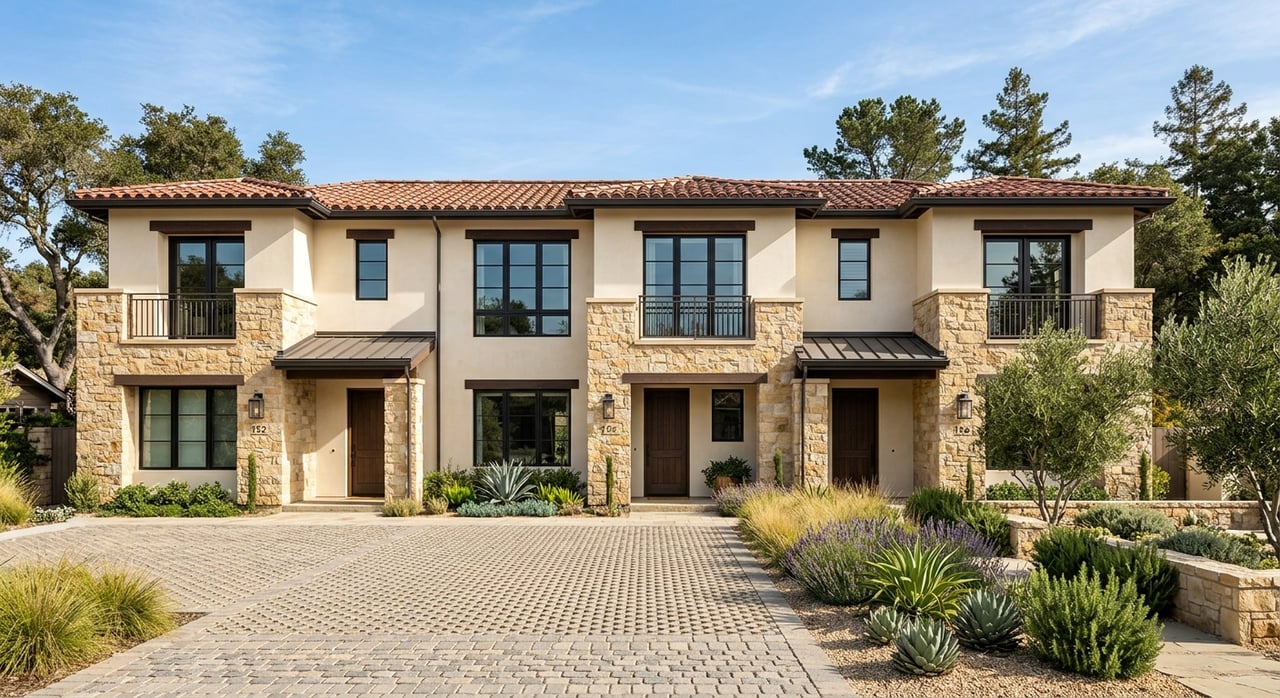
Ownership patterns help explain the feel of each market. Owner occupancy in Yorba Linda is roughly 83 percent compared with about 60 percent in Brea, according to recent American Community Survey estimates. You will see more single-family homes and larger lots in Yorba Linda, while Brea offers a wider mix of single-family, townhomes, and condos that can lower the entry cost for buyers. For commute context, mean travel times are similar at about 31 minutes in both cities, based on recent ACS QuickFacts. You can review city-level commute data in the latest federal tables from U.S. Census QuickFacts.
Brea vs Anaheim Hills
Brea and Anaheim Hills are close on median sale price, with recent snapshots placing Anaheim Hills around $1.08M to $1.10M. Price per square foot in Anaheim Hills is slightly higher, at about $598 versus about $579 in Brea. In practical terms, Brea may yield a bit more space for the same budget, depending on neighborhood and property condition.
Time to sell is another separator. Brea’s median days on market in early 2026 ran about 27 to 33 days, while Anaheim Hills sat near 50 days. If you want a faster tempo, Brea has recently moved quicker. If you want foothill settings and certain community features, Anaheim Hills can fit those goals at a similar headline price.
HOA exposure often reflects property type and community age. Both cities include condos and townhomes with monthly dues. In Brea, sample listings often show HOA dues in the mid to high $100s or low $200s. In Anaheim Hills, you will find a wider band from the low hundreds to several hundred dollars per month, depending on amenities. Always verify each listing’s HOA packet to confirm budget, reserves, and any special assessments.
Brea vs Orange
Orange often carries the highest price per square foot in this group, recently around $636, tied to central and historic neighborhoods that command a premium. Its median sale price sits near $1.20M in the latest snapshots, right in line with Yorba Linda. Compared with Brea at about $579 per square foot, you may trade some interior space for location and character in Orange.
Market pace in Orange sits between Brea and Yorba Linda, with a recent median days on market near 47 days. Active listings also run higher in Orange, reflecting its larger housing stock and variety of neighborhoods.
If you want proximity to central county job centers and a historic housing fabric, Orange is worth a look. If you want slightly more space for your budget with strong retail and freeway access, Brea makes a strong case.
What your budget buys
Price per square foot helps you estimate how much space your budget may cover. These are rough planning tools, not promises, because condition, lot size, upgrades, and micro-location can swing real results.
- At a $1.1M budget, Brea’s recent $579 per square foot points to roughly 1,900 square feet for a typical home, while Orange at about $636 per square foot points to roughly 1,730 square feet.
- At a $900K budget, that same math suggests about 1,555 square feet in Brea versus about 1,415 square feet in Orange. Yorba Linda and Anaheim Hills fall in between Brea and Orange on a $ per square foot basis.
Use these figures to frame tradeoffs, then compare real listings and recent comps to fine tune your target.
Competition and pricing power
Brea shows strong buyer demand. A recent sale-to-list snapshot placed Brea near 104 percent, a sign that well-priced homes often draw multiple buyers. Median days on market in the high 20s to low 30s backs up that momentum.
If you are selling, smart pricing to recent comps and polished presentation can help you capture top-of-market attention in the first two weeks. If you are buying, plan for pre-approval, fast timelines, and a clear ceiling for counter offers so you can compete without overreaching.
HOA dues and monthly costs
HOA dues can add a few hundred dollars per month to your payment. Nationally, the share of listings with an HOA has climbed to about 44 percent, with a median of roughly $135 per month, according to a 2025 report you can view through this Realtor.com HOA study summary. In North Orange County, many condos and townhomes carry dues in the low to mid hundreds, and amenity-rich or gated communities can exceed that range.
Local examples show Brea townhomes and condos often in the high $100s to low $200s per month, with Yorba Linda condos and some gated communities in the $400 to $700-plus range. Single-family homes in older tracts may have no HOA at all. Always request the HOA budget, reserve study, and CC&Rs to confirm expenses, rules, and capital plans.
Mello-Roos special taxes
Mello-Roos is a special tax tied to a Community Facilities District. It shows up on the county tax bill and is separate from HOA dues. Some newer communities in Orange County include these taxes, while many established tracts do not. Yorba Linda is known for having fewer parcels with Mello-Roos than some neighboring cities, though you should verify each property.
To learn how Mello-Roos works at a high level, review a public-agency FAQ like this city page that explains California’s Community Facilities District law: Mello-Roos overview and FAQs. Before you write an offer, ask your agent to pull the county tax bill and preliminary title to confirm whether a property has any CFDs and the annual amount.
Commute and connectivity
Mean travel times are a helpful benchmark for daily life. Recent five-year estimates show Brea at about 31.1 minutes, Yorba Linda at about 31.0 minutes, Anaheim at about 28.2 minutes, and Orange at about 25.8 minutes. You can explore the underlying tables at U.S. Census QuickFacts.
Brea offers quick access to SR-57 and SR-90, which serves commuters bound for LA County and central OC. Anaheim Hills connects to SR-91 and regional arterials. Yorba Linda also taps SR-91 and the 241 toll road, while Orange benefits from the 55, 57, and 22 connections. Your final choice often comes down to which corridor you use most days and what you value more, like space, price, or proximity.
How to choose your best fit
- If you want more square footage per dollar with strong retail access and a fast-selling market, put Brea high on your list.
- If you favor larger-lot single-family options and are comfortable with a slightly higher price per square foot, Yorba Linda could be a match.
- If you like foothill settings and similar medians to Brea, compare Anaheim Hills communities side by side.
- If you want central OC connectivity and historic or established neighborhoods, weigh Orange even if the $ per square foot is higher.
Ready to compare homes and numbers on your terms? Our marketing-first approach pairs clear pricing strategy with polished staging, photography, and targeted ads so you can sell fast and buy with confidence. When you want data plus execution, connect with Heather Stevenson - The Stevenson Team.
FAQs
What is the current median home price in Brea?
- Recent snapshots show Brea near $1.15M, based on early 2026 transaction medians.
How do Brea prices compare to Yorba Linda and Orange?
- Yorba Linda and Orange both sit around $1.20M, which is a notch above Brea’s recent $1.15M median.
Which city has the highest price per square foot right now?
- Orange typically leads at about $636 per square foot, followed by Yorba Linda around $613, then Anaheim Hills and Brea in the high $500s.
Where are homes selling fastest among these cities?
- Brea has been fastest in recent snapshots with a median of roughly 27 to 33 days on market, compared with Orange near 47 days and Yorba Linda around 69 days.
Are homes in Brea selling over list price?
- Yes. A recent sale-to-list reading for Brea was about 104 percent, which signals strong competition for well-priced homes.
How common are HOAs and how much do they cost?
- HOAs are common for condos and townhomes. Nationally, about 44 percent of listings have HOAs with a median of $135 per month, and local dues in North OC often run in the low to mid hundreds depending on the community. See the 2025 HOA study summary for context.
What is Mello-Roos and how does it affect my payment?
- Mello-Roos is a special tax tied to a Community Facilities District that appears on your property tax bill and can raise your monthly cost. Learn the basics in this public-agency FAQ, then verify the parcel’s tax bill before you offer.
How do average commutes compare across these cities?
- Recent estimates show Brea and Yorba Linda near 31 minutes, Anaheim about 28 minutes, and Orange about 26 minutes. You can check current figures at U.S. Census QuickFacts.